
Introduction
Modern cloud-native architectures move faster than human operators can scale. As organizations shift from monolithic applications to ephemeral, microservices-based topologies running on Kubernetes, the sheer volume of logs, metrics, traces, and events grows exponentially.
Traditional monitoring setups rely on static thresholds. When an enterprise infrastructure scales up or down dynamically, these static thresholds break, leading to two major operational bottlenecks: massive alert fatigue and siloed visibility. Engineers find themselves drowning in downstream alerts when a single upstream core dependency experiences latency.
This is where Artificial Intelligence for IT Operations (AIOps) becomes essential. Rather than replacing the foundational principles of DevOps and Site Reliability Engineering (SRE), AIOps supercharges them. By applying machine learning models to streaming telemetry data, engineering teams can shift from reactive firefighting to proactive, intelligent operations.
Table of Contents
- What is AIOps?
- Why AIOps Matters to Modern Engineering Teams
- The Core Problems AIOps Solves
- Key Components of an AIOps Platform
- The Technical Workflow: How Telemetry Becomes Actionable Insight
- Real-World Enterprise Use Cases
- Measurable Technical and Business Benefits
- Architectural Best Practices for Implementation
- Common Operational Mistakes to Avoid
- Phased Enterprise Roadmap for AIOps Adoption
- Structural Comparison: Traditional Monitoring vs. AIOps
- Career Trajectory and Market Demand for Specialists
- Frequently Asked Questions (FAQs)
What is AIOps?
AIOps, or Artificial Intelligence for IT Operations, refers to the strategic application of data science, machine learning (ML), and natural language processing (NLP) to automate and enhance IT operational workflows. Coined originally to define the convergence of big data and analytics, today’s enterprise definition is highly focused on actionable operational intelligence.
At its core, AIOps ingests diverse, distributed telemetry data from across the enterprise footprint—including public cloud providers, on-premises infrastructure, container runtimes, and application code. The platform then normalizes this data, detects statistical anomalies, clusters related events, and isolates the underlying root causes of complex software failures.
Why AIOps Matters to Modern Engineering Teams
DevOps unified development and operations by emphasizing continuous integration, continuous delivery, and shared infrastructure ownership. SRE institutionalized this relationship by applying software engineering disciplines directly to operations problems, using metrics like Service Level Objectives (SLOs) and Error Budgets to balance velocity and reliability.
However, human cognitive capacity remains fixed while system complexity expands. When a distributed system spans thousands of pods across multiple managed Kubernetes clusters, tracking down a silent degradation via manual dashboard inspection becomes impossible.
AIOps fills this gap by acting as a force multiplier for DevOps and SRE frameworks. It ingests high-cardinality data, maps real-time behavioral dependencies, and provides the algorithmic reasoning necessary to protect SLOs automatically. Teams looking to master this convergence can explore an AIOps Course or pursue structured AIOps Training to build foundational competencies.
The Core Problems AIOps Solves
Alert Fatigue and the Blameless Post-Mortem
When an enterprise database experiences disk I/O throttling, dozens of downstream microservices will simultaneously throw connection timeouts. Traditional monitoring setups trigger individual PagerDuty incidents for every single affected service. The resulting “alert storm” paralyzes on-call engineers. AIOps uses temporal and topological event correlation to group these thousands of alerts into a single, cohesive incident context.
Siloed Data Streams
Infrastructure teams watch CPU utilization in Grafana. Application teams trace bottlenecks in APM tools. Network teams monitor packet drops. When a major incident occurs, every team brings isolated data to the war room, claiming their specific domain is healthy. AIOps breaks down these silos by ingesting all data streams into a unified data lake, analyzing telemetry correlation across architectural boundaries.
The Reactive Operational Cycle
Traditional SRE workflows trigger after a threshold is breached—meaning users are already experiencing a performance penalty. By leveraging predictive analytics on historical data trends, AIOps detects early warning signs, such as anomalous memory drift or slow queues, giving engineers the window needed to remediate before an SLO is violated.
Key Components of an AIOps Platform
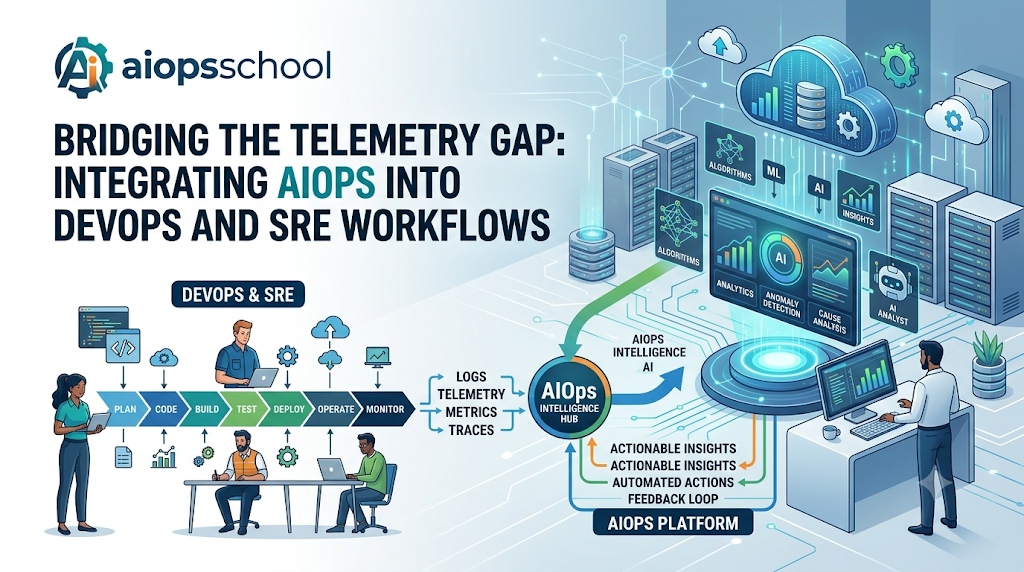
[Telemetry Ingestion] ---> [Data Normalization] ---> [ML Analytics Engine] ---> [Automation Layer]
(Metrics, Logs, Traces)    (OpenTelemetry Standard)  (Anomaly, Correlation)    (Self-Healing Scripts)
1. Data Ingestion Pipeline
The foundation of any operational platform is its data collection mechanism. Modern platforms rely heavily on open-source standards like OpenTelemetry to capture distributed traces, metrics, and logs directly from application runtimes and cloud infrastructure without proprietary vendor lock-in.
2. Analytical Engine
This component runs real-time statistical algorithms and unsupervised machine learning models against streaming data. It performs dynamic baseline calculations, moving away from rigid manual thresholds to adapt naturally to rhythmic business cycles, such as weekend traffic drops or seasonal e-commerce spikes.
3. Event Correlation and Deduplication Engine
This layer analyzes the structural relationships between distinct alert signals. By leveraging topological graphs of the infrastructure (e.g., knowing exactly which pods run on which virtual nodes connected to specific virtual networks), the engine suppresses redundant notifications and highlights the true primary trigger.
4. Automated Remediation Layer
Once an anomaly is identified and isolated, the platform interfaces with configuration management and infrastructure-as-code tools. It triggers automated runbooks—such as clearing temporary caches, restarting microservices under strict policy control, or dynamically scaling cluster groups—to execute automated healing without human intervention.
The Technical Workflow: How Telemetry Becomes Actionable Insight
To successfully deploy these capabilities, enterprise teams typically engage with specialized AIOps Consulting and AIOps Implementation Services to map out data flows. The end-to-end processing pipeline runs through four clear technical phases:
- Ingestion & Normalization: Continuous telemetry collection across hybrid infrastructures. Data elements are timestamped, indexed, and formatted into uniform data structures.
- Dynamic Baselining: Machine learning models study historical operational patterns over rolling windows (typically 7 to 30 days) to establish what normal system behavior looks like for various hours of the day.
- Anomaly & Correlation Analysis: The platform detects statistical deviations from the dynamic baseline. If anomalous behaviors occur simultaneously across related components, the system clusters them into a single analytical incident.
- Root Cause Isolation & Remediation: The platform presents the engineer with the exact log line, configuration drift event, or code deployment that initiated the failure chain, alongside an optional executable orchestration script to resolve the bug.
Real-World Enterprise Use Cases
Intelligent Alerting in E-Commerce Platforms
During high-traffic shopping events, microservice interaction speeds fluctuate rapidly. Instead of setting rigid 200ms latency alert rules that trigger constantly during peak volumes, an enterprise utilizes intelligent alerting. The analytical engine identifies that while latency has risen to 350ms, it matches the expected traffic profile and does not represent an error condition, safely suppressing thousands of false alarms.
Automated Incident Intelligence for Financial Systems
A payment gateway experiences an abrupt drop in transaction completions. The platform automatically correlates a recent continuous deployment pipeline execution with an spike in HTTP 503 errors on the checkout service. It points the on-call engineer to the exact code commit responsible, trimming investigation times from hours to seconds.
Proactive Resource Optimization in Cloud-Native Infrastructure
By continually monitoring CPU and memory usage patterns across thousands of Kubernetes nodes, the analytical model predicts cluster saturation events 45 minutes before they happen. It signals the underlying auto-scalers to provision capacity smoothly, avoiding sudden latency drops during sharp utilization spikes.
Measurable Technical and Business Benefits
- Significant Reduction in MTTR: By pointing directly to the root cause of an infrastructure breakdown, teams dramatically reduce Mean Time to Resolution, saving significant operational costs during severe outages.
- Drastic Elimination of Alert Noise: Consolidating thousands of disparate alerts into unified, contextualized incident reports reduces alert fatigue by up to 90%, allowing on-call teams to focus on system improvements rather than alert triage.
- Improved SLO/SLA Compliance: Proactive, anomaly-driven warning systems let infrastructure teams resolve systemic bottlenecks before they impact end-user experiences or violate commercial service commitments.
- Optimized Resource Allocation: Continuous, ML-driven analysis of compute footprints allows platform teams to rightsizing over-provisioned staging and production instances, driving down annual cloud expenditures.
Architectural Best Practices for Implementation
Standardize on OpenTelemetry
Avoid binding your core operational logic to proprietary data formats. Leverage open telemetry standards to instrument applications and export infrastructure metrics cleanly. This ensures your data platform remains fully modular and future-proof.
Implement Comprehensive AI Observability
To effectively optimize complex workloads, software engineers must pursue rigorous AI Observability Training. This specialized educational track teaches operators how to trace internal model states, evaluate pipeline data drifts, and ensure the operational integrity of the analytical tools monitoring your infrastructure.
Rely on Topological Context
Machine learning algorithms operating in a vacuum without context struggle to provide value. Feed your infrastructure mapping data (such as service mesh graphs, cloud architecture layouts, and dependency manifests) directly into your analysis platform to ensure accurate structural event correlation.
Common Operational Mistakes to Avoid
- Treating Automation as a Magic Wand: Platforms cannot fix a fundamentally broken, unmonitored infrastructure. AIOps requires solid telemetry data, structured logs, and clear operational practices to yield accurate, actionable insights.
- Enabling Automatic Remediation Without Controls: Allowing an untested machine learning engine to execute destructive infrastructure actions (such as dropping databases or forcing large scale node terminations) without human verification gates risks worsening existing outages.
- Ignoring Data Hygiene Standards: Ingesting dirty, unindexed, or poorly formatted log streams leads to flawed machine learning outputs. Spend appropriate time clean-up and structuring tags and labels across your ecosystem before training algorithms.
Phased Enterprise Roadmap for AIOps Adoption
+-----------------------------------------------------------------------------+
| Phase 1: Establish Telemetry Foundations (OpenTelemetry, Prometheus)        |
+-----------------------------------------------------------------------------+
                                      |
                                      v
+-----------------------------------------------------------------------------+
| Phase 2: Ingest & Correlate Events (De-duplication, Topology Mapping)       |
+-----------------------------------------------------------------------------+
                                      |
                                      v
+-----------------------------------------------------------------------------+
| Phase 3: Deploy Predictive Analytics (Dynamic Baselining, Anomaly Detection) |
+-----------------------------------------------------------------------------+
                                      |
                                      v
+-----------------------------------------------------------------------------+
| Phase 4: Enable Closed-Loop Automation (Self-Healing Runbooks)              |
+-----------------------------------------------------------------------------+
To implement these steps systematically, organizations frequently utilize comprehensive AIOps Online Training systems to upskill distributed engineering units simultaneously, ensuring consistent execution across each developmental phase.
Structural Comparison: Traditional Monitoring vs. AIOps
| Capability Parameter | Traditional Monitoring Infrastructure | Modern Advanced AIOps Environment |
| Threshold Configuration | Manual configuration based on rigid static values. | Dynamically adjusted based on real-time operational baselines. |
| Alert Management | Fires individual alerts per component, causing alert storms. | Deduplicates and clusters related errors into single root incidents. |
| Root Cause Analysis | Requires manual exploration across separate tracking systems. | Automatically isolates root causes using topological and log analysis. |
| Operational Strategy | Completely reactive; flags errors only after service drops. | Highly proactive; uses predictive analytics to flag early anomalies. |
| Telemetry Ingestion | Often limited to siloed datasets or single vendors. | Ingests high-cardinality data cross-domain using open standards. |
Career Trajectory and Market Demand for Specialists
As enterprises accelerate their cloud migrations, the demand for operations experts who understand data science methodologies is scaling rapidly. Engineering professionals who specialize in this discipline command significant premiums in the current technology market.
                  Senior AIOps Enterprise Architect
                                 ^
                                 |
                     Lead Platform/SRE Engineer
                                 ^
                                 |
         Certified AIOps Engineer / DevSecOps Specialist
                                 ^
                                 |
             DevOps / Infrastructure/ SRE Practitioner
Transitioning into these high-value positions requires verifiable skills validation. Professionals looking to lead these initiatives should pursue formal AIOps Certification and comprehensive AIOps Engineer Training. Earning an industry-recognized AIOps Engineer Certification validates your technical mastery of stream processing, predictive analytics, and automated operational orchestration, helping you stand out to enterprise recruitment teams globally.
Frequently Asked Questions (FAQs)
1. How does AIOps differ from standard APM tools?
Application Performance Monitoring (APM) tools focus on capturing code-level execution details and localized performance within an application wrapper. An AI operations platform sits above APM tools, ingesting their data alongside network packet logs, cloud infrastructure metrics, and configuration drift records to provide an end-to-end view of the entire enterprise ecosystem.
2. Can AIOps operate effectively within a hybrid cloud environment?
Yes. Modern frameworks are built to ingest normalized telemetry data from distributed sources via open protocols. This allows the system to build dependency models that track processes seamlessly as they travel between legacy on-premises datacenters and multi-cloud environments.
3. What role does OpenTelemetry play in an AIOps framework?
OpenTelemetry provides an open, vendor-neutral framework for collecting and exporting logs, metrics, and traces. It serves as the data collection layer, feeding standardized, high-quality data into the analytical engine for parsing, anomaly detection, and correlation.
4. Will adopting machine learning technologies phase out traditional SRE positions?
No. Machine learning models automate low-level, repetitive tasks like manual log digging, alert triaging, and basic runbook execution. This frees up SRE teams to focus on high-value engineering challenges, such as optimizing systemic architecture, refining application design, and improving overall platform resilience.
5. How does dynamic baselining accommodate sudden, valid traffic spikes?
Dynamic baselining models evaluate historical trends, calendar events, and multi-metric patterns. For example, if a spike in incoming HTTP requests aligns with a scheduled marketing event or historical payday traffic, the analytics engine recognizes the pattern and avoids triggering false resource alerts.
6. What is the typical timeframe required to train analytics engines?
While basic anomaly detection models can begin tracking metrics immediately using rolling averages, most advanced machine learning engines require between 14 to 30 days of continuous telemetry data ingestion to establish highly accurate baseline behaviors and account for cyclical weekly patterns.
7. Is an AIOps architecture suitable for small-scale development startups?
While startups can benefit from automated alerting tools, the true value of an end-to-end platform scales with infrastructure complexity. Organizations managing massive microservices environments, large scale Kubernetes workloads, and high data volumes realize the highest return on investment.
8. How should teams validate automated scripts before allowing self-healing?
Organizations should follow a progressive trust roadmap. Start by configuring the platform to run root cause diagnostics and recommend runbooks as manual click-to-trigger suggestions for engineers. Once those runbooks consistently prove accurate over a sustained period, teams can safely enable hands-off, automated execution.
Conclusion
The scale of modern cloud-native infrastructures has outpaced traditional, manual monitoring frameworks. To maintain operational velocity without sacrificing system stability, DevOps and SRE teams must adopt automated, algorithmically driven operations models.
By unifying data streams, utilizing dynamic baselining, and automating incident intelligence pipelines, enterprise organizations can significantly reduce operational noise, protect their SLOs, and allow engineers to spend their valuable time building scalable features rather than triaging alerts.
The path toward operational maturity begins with education. Whether you are an infrastructure specialist looking to advance your career with an AIOps Engineer Training program, or an enterprise leader looking to overhaul your system workflows via targeted AIOps Consulting, integrating machine learning into your operational toolkit is essential for driving sustainable, cloud-native scalability.

